Beyond 0.05: Interpreting P-Values in a Clinical Trial

Frequentist Thinking III − Beyond 0.05: Interpreting P-Values in a Clinical Trial
Keywords: clinical trial, p-value, research hypothesis, survival & competing risks
A way of thinking for interpreting p-values correctly
Daughter: “I’m home, Dad. It’s about time we got the down jackets out. Oh, can I have a cup of hot coffee?”
Dad: “I figured you’d be back soon, so I made plenty. Hey, remember when we talked about survival curves and p-values in the JCOG9502 paper (Sasako et al. 2006)? Something stuck with me. Why do people say, ‘if the p-value is less than 0.05, it’s statistically significant’?”
Daughter: “Isn’t that just the rule?”
Dad: “That’s a common way to read papers—and it’s the wrong one here. Let me ask you: when you read a paper, you start with the Abstract. Then what do you read next?”
Daughter: “The Results. I want to know what happened as quickly as possible.”
Dad: “I understand. But when it comes to p-values, if you want a correct interpretation, you need to read the Methods first. People have worried for a long time that p-values are widely misunderstood in the scientific community. The American Statistical Association (ASA) even issued a statement aimed at researchers who aren’t statisticians, as well as practitioners and science writers. One trigger was a forum post like this, submitted to the ASA in February 2014.”
Daughter: “What is this—a Zen koan?”
Q. Why do so many colleges and grad schools teach p ≤ 0.05?
A. Because that’s what the scientific community and journal editors use
Q. Why do so many people still use p ≤ 0.05?
A. Because that’s what they were taught in college or grad school
Dad: “And the ASA summarized six principles for using and interpreting p-values.”
- P-values can indicate how incompatible the data are with a specified statistical model.
- P-values do not measure the probability that the studied hypothesis is true, or the probability that the data were produced by random chance alone.
- Scientific conclusions and business or policy decisions should not be based only on whether a p-value passes a specific threshold.
- Proper inference requires full reporting and transparency.
- A p-value, or statistical significance, does not measure the size of an effect or the importance of a result.
- By itself, a p-value does not provide a good measure of evidence regarding a model or hypothesis.
Daughter: “So that little back-and-forth set off a wave of p-value criticism. But honestly, all six still feel abstract to me.”
Dad: “Really? ‘Scientific conclusions shouldn’t be based only on whether a p-value crosses a threshold’ is pretty explicit. In JCOG9502, for example, principles 3 and 5 are basically telling you: don’t look only at the p-value—look carefully at the survival curves before you conclude anything. Still, without some background, it’s hard to see what the principles are trying to protect you from. Principle 4, for instance, is closely tied to the problem of multiplicity.”
Daughter: “Multiplicity?”
Dad: “In many modern trials, multiplicity is quietly built in. Let’s use JCOG9502 to make it concrete. Go back to the Statistical Analysis section. The phrase alpha error—also called the significance level—refers to the threshold you compare the p-value against.”
After 8 years of slow accrual, the JCOG data and safety monitoring committee approved an amendment to the sample size and analysis plan. The amended sample size was 250, with one-sided alpha error of 0.1 and beta error of 0.2, with a 12-year accrual period (in total) and 8-year follow-up. (Sasako, et al. 2006)
Daughter: “So they compare the p-value to 0.1? Not 0.05?”
Dad: “Right. In an ideal world, alpha is the textbook 0.05. And you’re not supposed to change alpha mid-trial. That’s standard practice. But when accrual stalls, sometimes the trial has to be adjusted to stay interpretable. That seems to be what happened here: they loosened alpha to 0.1 as a last resort.”
Daughter: “I skipped right past that.”
Dad: “Now, with Principle 4 and its explanation in mind, look at Figure A and Figure B in JCOG9502. Two survival curves, and four p-values, right? Do you know how to read multiple p-values like this?”
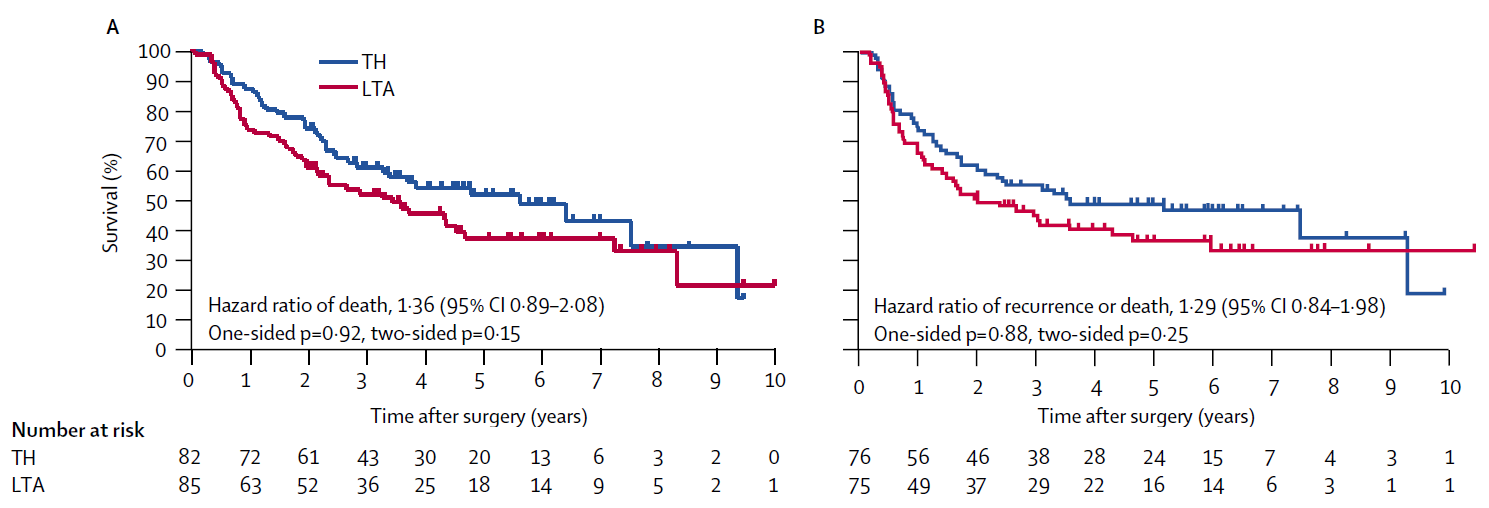
Daughter: “That’s exactly why I asked you in the first place. Of course I thought about the p-values in Figure A and Figure B. You’re supposed to focus on Figure A: the primary endpoint in JCOG9502 is OS, and Figure A is overall survival. But even in Figure A, there are both one-sided and two-sided p-values. That part made no sense—I got stuck.”
Dad: “That part isn’t too hard. Imagine you’re comparing an experimental treatment with a standard treatment in a clinical trial. A one-sided p-value is used when you will call the result ‘significant’ only if the experimental arm wins. A two-sided p-value is used when you judge statistical significance regardless of which arm appears better.”
Daughter: “Reading the paper, the protocol treated LTA as the experimental treatment and TH as the standard. Maybe because LTA is more invasive. So they’d only declare significance if the LTA group had better outcomes. Is that normal?”
Dad: “Not really. Two-sided p-values are the usual standard. But in many JCOG trials, the scientific question is specifically whether the experimental arm improves outcomes over standard care—and they often compare treatments that differ in toxicity or invasiveness. In that context, a one-sided hypothesis can feel more ‘natural,’ and JCOG allows one-sided p-values for that reason (Japan Clinical Oncology Group 2025). The idea is: if it isn’t significant on the one-sided test, you keep using the standard treatment—so that’s acceptable. In this paper, the two-sided p-values are more like a reference. In practice, the primary judgment of efficacy hinges on the one-sided p-value in Figure A.”
Daughter: “Then for my observational study—stoma vs no stoma and return to work—given what the hypothesis means, two-sided p-values are what you’d recommend. That makes sense. Got it.”
P-values appear in nearly every scientific field, but concerns have been raised that they are misused and that they can distort how findings are interpreted. A familiar pattern is that once a small p-value is obtained, the result is treated as ‘important’ by default, or decisions are made mechanically just because p < 0.05. You have likely seen examples of this yourself.
In 2016, the American Statistical Association (ASA) summarized six principles to improve the practice and interpretation of quantitative research (Wasserstein and Lazar 2016). For convenience, the six principles are reproduced here.
- P-values can indicate how incompatible the data are with a specified statistical model.
- P-values do not measure the probability that the studied hypothesis is true, or the probability that the data were produced by random chance alone.
- Scientific conclusions and business or policy decisions should not be based only on whether a p-value passes a specific threshold.
- Proper inference requires full reporting and transparency.
- A p-value, or statistical significance, does not measure the size of an effect or the importance of a result.
- By itself, a p-value does not provide a good measure of evidence regarding a model or hypothesis.
Textbooks often explain p-values mainly through the relationship between the p-value and the null hypothesis. But to interpret a p-value, the null hypothesis is not the only thing that matters. The spirit of the ASA statement is this: unless you use the full context—study design, data collection, analysis choices, and reporting—you cannot interpret p-values properly.
Focus on Principle 4. In its discussion, the ASA warns that if multiple analyses are performed and only selected p-values are reported, then the reported p-values become fundamentally uninterpretable. Put plainly: when there are many p-values available, it becomes tempting—consciously or not—to choose the convenient ones. This kind of “best-picking” has become widespread in science and is suspected to contribute to an excess of false positives in the literature. In statistics, this cluster of concerns is discussed under terms such as multiplicity or selective inference.
When you read a p-value, do not isolate the number from the rest of the paper. Return to the Methods and check the null hypothesis, primary outcome, significance level, one-sided or two-sided testing, interim analyses, and how multiplicity was handled. If those choices change, the same numerical p-value can mean something different.
That is why it is risky to judge a study simply because p = 0.04. A p-value has meaning within the Methods section and the analysis plan. It becomes interpretable only after you check whether it came from a question, primary outcome, comparison, significance level, and analysis procedure specified in advance.
P-values and hypothesis tests are statistical procedures designed to make a yes/no judgment about a hypothesis. That may sound intimidating, so let’s use an analogy.
Suppose you flip a coin and get six heads in a row. Is the coin rigged (i.e., is the probability of heads not 1/2)? A p-value approach thinks like this: under the hypothesis “P(heads) = 1/2,” the probability of six heads in a row is (1/2)^6 = 0.0156. The probability of six tails in a row is the same, 0.0156. So the probability of observing something this extreme is their sum: p = 0.0312. Isn’t it strange to get such an extreme pattern if the coin were fair? That logic is how a p-value is used to doubt the hypothesis “P(heads) = 1/2.”
A one-sided p-value corresponds to looking at only one direction of extremeness (e.g., “too many heads”): p = 0.0156.
A two-sided p-value corresponds to looking in both directions (“too many heads or too many tails”): p = 0.0312.
Now return to JCOG9502. Hypothesis testing proceeds in three conceptual steps.
First, you specify hypotheses. In JCOG9502, the truth could be either: “LTA prolongs overall survival compared with TH,” or “it does not.” In hypothesis testing we focus on the “no effect” statement and call it the null hypothesis (this corresponds to “P(heads) = 1/2” in the coin example).
Second, you ask how the data would behave under the null. Imagine repeating the same trial—same design, 167 patients—one thousand times. This is the frequentist way of thinking. Even if there were truly no effect, random error would sometimes make the LTA curve look better and sometimes make the TH curve look better. But across many repetitions, the results would center around “no difference.” You then compare that hypothetical distribution with what you actually observed, and compute a p-value.
A p-value is the probability—under the assumption that the null hypothesis is true (i.e., no difference between survival curves)—of observing a difference as extreme as, or more extreme than, the one you observed. If the p-value is small, you conclude that such an extreme difference would be unlikely under “no difference,” and so you doubt the null. If the p-value is large, you conclude that what you observed is unremarkable under the null.
Excluding non-inferiority and equivalence trials, two-sided p-values are considered standard in most randomized clinical trials. Which of the following is the correct reason?
- Because whether the experimental treatment is better or worse, if there is a difference, we want to conclude there is a difference.
- Because it is a rule among statisticians.
- Because using the same standard worldwide reduces confusion.
- Because random error creates variability in both upward and downward directions around the mean
- The correct answer is 3.
This is largely historical. When the ICH E9 guideline was established, regulators in the US, Europe, and Japan agreed to treat two-sided p-values as the default in confirmatory trials (Yoshimura 2003).
Reference
JCOG protocol manual version 3.8 [Internet]. Tokyo: Japan Clinical Oncology Group; 2025
Sasako M, Sano T, Yamamoto S, Sairenji M, Arai K, Kinoshita T, Nashimoto A, Hiratsuka M, Japan Clinical Oncology Group (JCOG9502). Left thoracoabdominal approach versus abdominal-transhiatal approach for gastric cancer of the cardia or subcardia: a randomised controlled trial. Lancet Oncol 2006;7(8):644-51
Wasserstein R and Lazar NI. The ASA’s statement on p-values: Context, process, and purpose. Am Statistician 2016; 70: 129-33
Yoshimura I. Significance levels and number of trials in confirmatory clinical trials - In relation to “Statistical Principles for Clinical Trials”-. Jpn J Biometrics 2003; 24: S3-9