Quick start
This package is a compact, high-level extension of the existing
survival ecosystem. It provides a unified interface for
Kaplan-Meier and Aalen-Johansen curves, modern visualization, and direct
polytomous regression for survival and competing risks data.
library(cifmodeling)
data(diabetes.complications)
cifplot(Event(t,epsilon)~fruitq, data=diabetes.complications,
        outcome.type="competing-risk", panel.per.event=TRUE)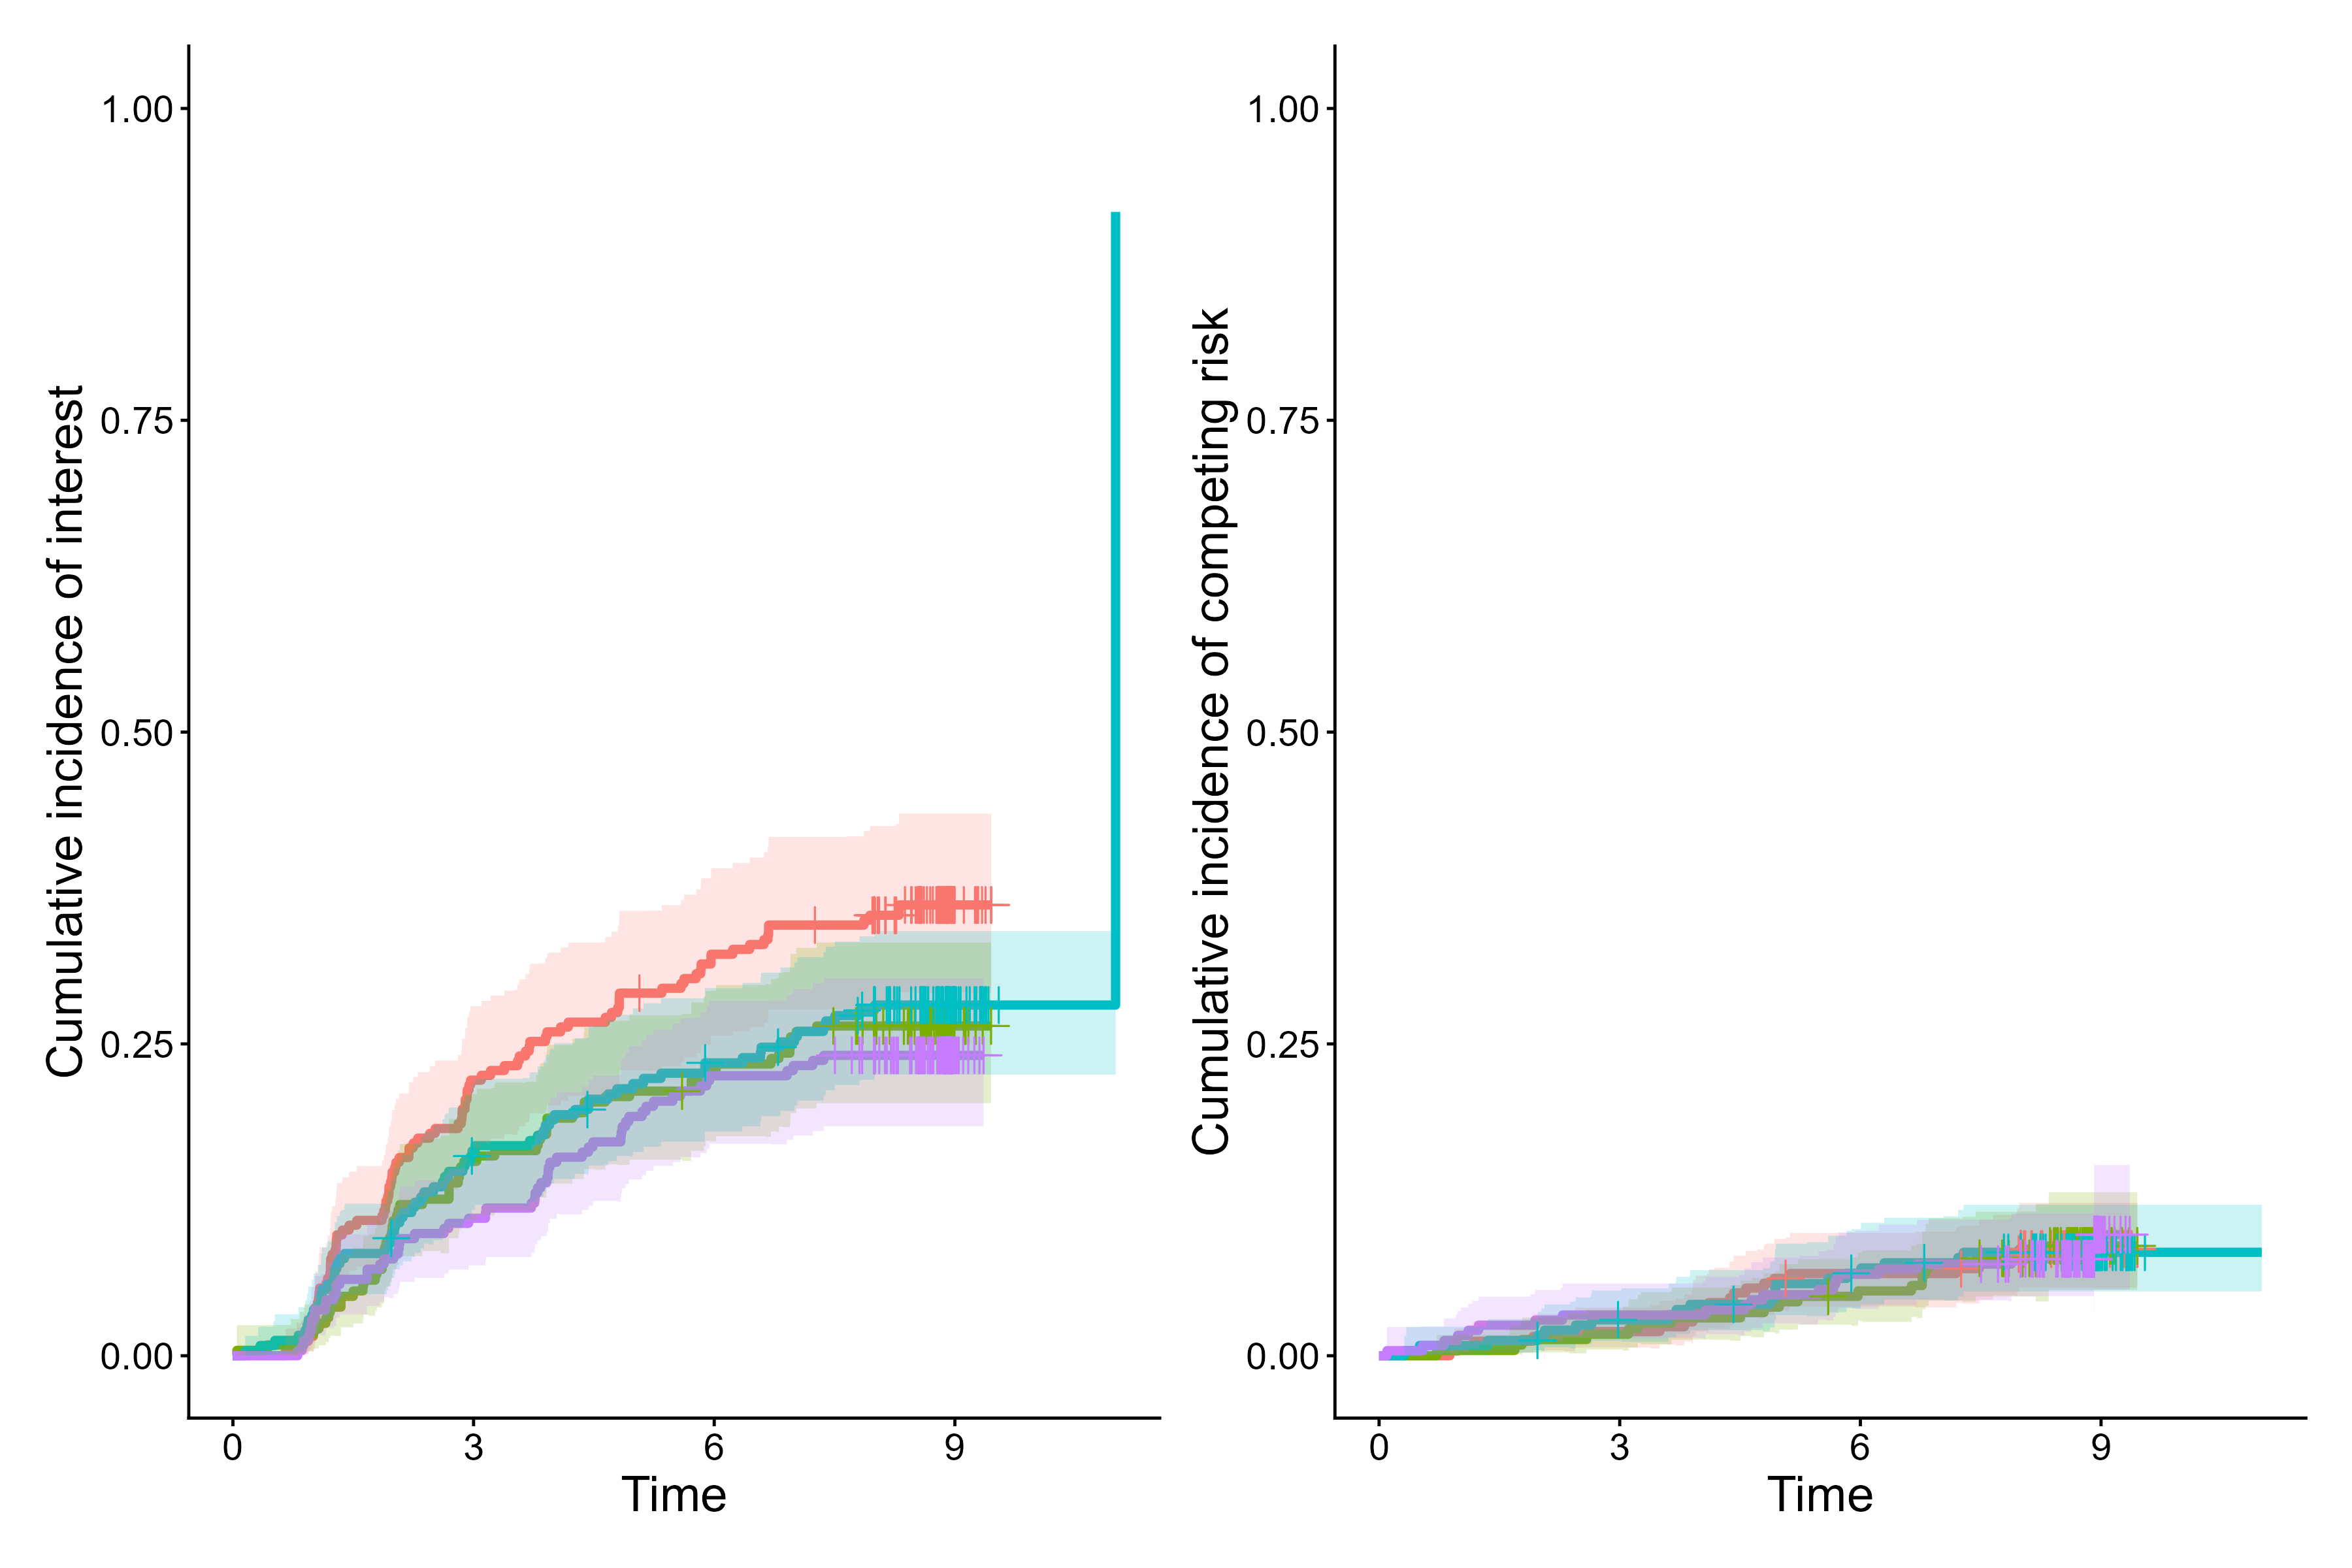
Aalen-Johansen cumulative incidence curves from cifplot()
In competing risks data, censoring is often coded as 0, the event of
interest as 1, and competing risks as 2. In the
diabetes.complications data frame, epsilon
follows this convention. With panel.per.event = TRUE,
cifplot() visualizes the cumulative incidence functions
(CIFs), with the CIF of diabetic retinopathy (epsilon = 1)
shown on the left and the CIF of macrovascular complications
(epsilon = 2) on the right.
Why cifmodeling?
-
Unified interface for Kaplan–Meier and
Aalen–Johansen curves, with survival and competing risks handled by the
same
Event()+ formula + data syntax. -
Effects on the CIF scale: while Fine-Gray models
subdistribution hazards,
polyreg()directly targets ratios of CIFs (risk ratios, odds ratios, subdistribution hazard ratios), so parameters align closely with differences seen in CIF curves. -
Coherent, joint modeling of all competing events:
polyreg()models all cause-specific CIFs together, parameterizing the nuisance structure with polytomous log odds products and enforcing that their CIFs sum to at most one. -
Tidy summaries and reporting: support for
generics::tidy(),glance(), andaugment(), which integratespolyreg()smoothly withmodelsummaryand other broom-style tools. -
Publication-ready graphics built on
ggsurvfitandggplot2, including at-risk/CIF+CI tables, censoring/competing-risk/intercurrent-event marks, and multi-panel layouts.
Tools for survival and competing risks analysis
In clinical and epidemiological research, analysts often need to
handle censoring, competing risks, and intercurrent events
(e.g. treatment switching), but existing R packages typically separate
these tasks across different interfaces. cifmodeling
provides a unified, publication-ready toolkit that integrates
nonparametric estimation, regression modelling, and visualization for
survival and competing risks data. The package is centered around three
tightly connected functions:
cifplot()typically generates a survival or CIF curve with marks that represent censoring, competing risks and intercurrent events. Multiple standard error (SE) estimators and confidence interval (CI) methods valid for unweighted and weighted data are supported. The visualization is built on top ofggsurvfitandggplot2.cifpanel()creates a multi-panel figure for survival/CIF curves, arranged either in a grid layout or as an inset overlay.polyreg()fits coherent regression models of CIFs using polytomous log odds products.
These functions adopt a formula + data syntax, return tidy,
publication-ready outputs, and integrate seamlessly with
ggsurvfit and modelsummary for visualization
and reporting.
Position in the survival ecosystem
Several excellent R packages exist for survival and competing risks
analysis. The survival package provides the canonical
API for survival data. In combination with the
ggsurvfit package, survival::survfit() can
produce publication-ready survival plots. For CIF plots, however,
integration in the general ecosystem is less streamlined.
cifmodeling fills this gap by offering
cifplot() for survival/CIF plots and multi-panel figures
via a single, unified interface.
Beyond providing a unified interface, cifcurve() also
extends survfit() in a few targeted ways. For unweighted
survival data, it reproduces the standard Kaplan-Meier estimator with
Greenwood and Tsiatis SEs and a unified set of CI
transformations. For competing risks data, it computes Aalen-Johansen
CIFs with both Aalen-type and delta-method SEs. For
weighted survival or competing risks data (e.g. inverse probability
weighting), it implements influence-function based SEs
(Deng and Wang 2025) as well as modified Greenwood- and
Tsiatis-type SEs (Xie and Liu 2005), which are valid under
general positive weights.
If you need very fine-grained plot customization, you can compute the
estimator and keep a survfit-compatible object with
cifcurve() (or supply your own survfit object) and then
style it using ggsurvfit/ggplot2 layers. In other
words:
- use
cifcurve()for estimation, - use
cifplot()/cifpanel()for quick, high-quality figures, and - fall back to the
ggplotecosystem when you want full artistic control.
The mets package is a more specialised toolkit that
provides advanced methods for competing risks analysis.
cifmodeling::polyreg() focuses on coherent modelling of all
CIFs simultaneously to estimate the exposure effects in terms of
RR/OR/SHR. This coherence can come with longer runtimes for large
problems. If you prefer fitting separate regression models for each
competing event or specifically need the Fine-Gray models (Fine and Gray
1999) and the direct binomial models (Scheike, Zhang and Gerds 2008),
mets::cifreg() and mets::binreg() are
excellent choices.
Installation
The package is implemented in R and relies on Rcpp,
nleqslv and boot for its numerical back-end.
The examples in this document also use ggplot2,
ggsurvfit, patchwork and
modelsummary for tabulation and plotting. Install the core
package and these companion packages with:
# Install cifmodeling from GitHub
devtools::install_github("gestimation/cifmodeling")

# Core dependencies
install.packages(c("Rcpp", "nleqslv", "boot"))

# Recommended packages for plotting and tabulation in this README
install.packages(c("ggplot2", "ggsurvfit", "patchwork", "modelsummary"))
Quality control
cifmodeling includes an extensive test suite built with
testthat, which checks the numerical accuracy and
graphical consistency of all core functions (cifcurve(),
cifplot(), cifpanel(), and
polyreg()). The estimators are routinely compared against
related functions in survival, cmprsk
and mets packages to ensure consistency. The package is
continuously tested on GitHub Actions (Windows, macOS, Linux) to
maintain reproducibility and CRAN-level compliance.