When Bias Creeps In: Selection, Information, and Confounding in Clinical Surveys

Study Design 5 − When Bias Creeps In
Keywords: bias, language & writing, observational study, study design
Biases to watch for in surveys
Me: “I’m back—so tired. Dad, do we have anything sweet left?”
Dad: “There’s some strawberry daifuku. I just made coffee too.”
Me: “That’s a lifesaver. Getting off work at this hour means rush-hour trains, and today was brutal from start to finish.”
Dad: “Sounds rough. Here you go—coffee’s ready.”
Me: “Thanks. Hey—people keep talking about hard endpoints and soft endpoints, right?”
Dad: “They do.”
Me: “There’s a senior doctor who’s very keen on doing clinical trials. They say things like, ‘Return-to-work is a soft endpoint, so it’s no good. Overall survival is a hard endpoint, so that’s better.’ It feels like my survey is being dismissed, but I don’t really understand what they mean.”
Dad: “It’s true that cancer trials often use overall survival as an endpoint, but judging everything by that standard alone is a bit simple. Also, people often use ‘hard’ and ‘soft’ casually, but if we’re being precise, it’s closer to objective versus subjective.”
Me: “Objective? Subjective?”
Dad: “A common example is this: OS is hard, PFS is soft. OS depends only on the date of death and the last confirmation of survival—that’s why people call it relatively objective. PFS, on the other hand, includes disease progression as an event, so you need information about when progression occurred. Clinically, that judgment can sometimes be subjective—based on symptoms, tumor markers, or imaging interpretation. Because those judgments can vary, some people call PFS a ‘soft’ endpoint.”
Me: “I see. So when people say hard and soft, they really mean objective and subjective. Then my questionnaire really is a soft endpoint—it’s asking about patients’ own experiences.”
Dad: “Maybe. But what your senior probably meant is that, when studying return to work, you should remove ambiguity as much as possible and measure things objectively. If patients can report their actual return-to-work date accurately, that’s already fairly objective.”
Me: “So can I think of it like this? Hard endpoints have no bias, and soft endpoints do?”
Dad: “Not quite. Subjectivity can make bias more likely, but it’s not that simple. If follow-up is sloppy, even death can be misclassified, and mortality can be underestimated. Mind if I have a cigarette?”
Me: “Go ahead. Tracking deaths really is hard, isn’t it?”
Dad: “Right. To be precise, you don’t need 100% complete information all the way to death. That only works, however, when the collection of death information itself is unbiased. If whether death information is obtained depends on the patient’s health condition, that becomes a source of bias. This is because censoring in survival data is no longer random. Remember the Kaplan-Meier and Aalen-Johansen curves I showed you earlier? Those curves can be drawn even with censoring. But for them to be unbiased and valid, censoring must occur independently of disease status or prognosis. For example, everyone being censored at one year by design, or follow-up stopping for external reasons. In the end, once information becomes systematically distorted, bias arises—regardless of whether the endpoint is hard or soft.”
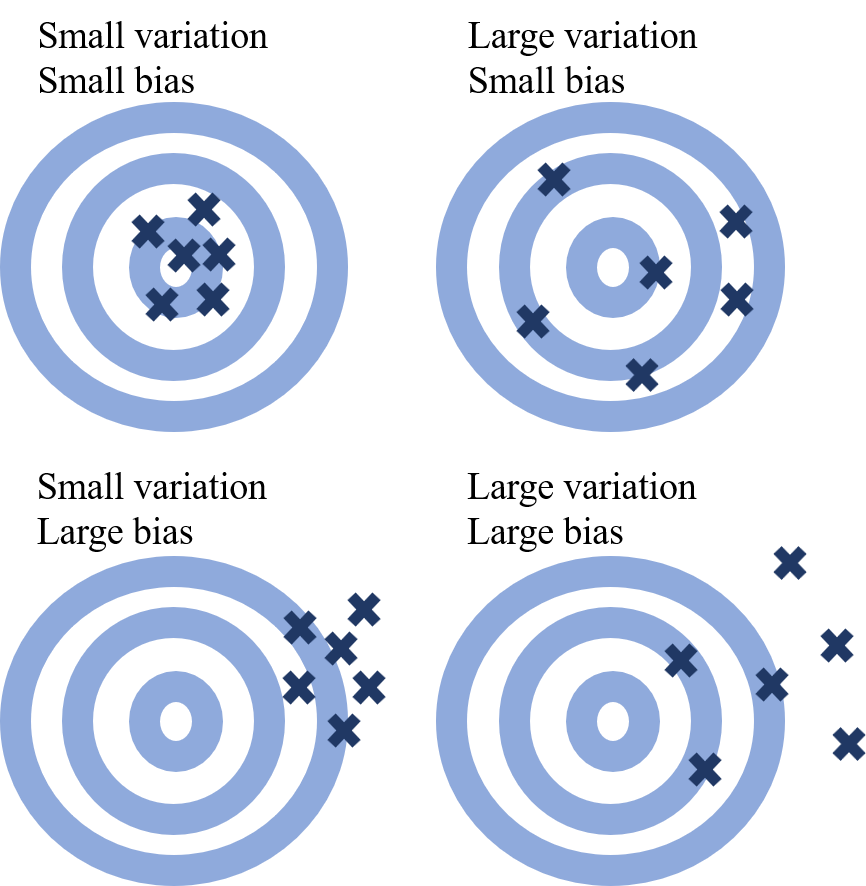
Statistics deals with uncertainty, but in clinical research it is crucial to distinguish random error from bias. Random error refers to variability around the true value, typically assumed to be centered around zero. Bias, in contrast, means that an estimate is systematically shifted away from the truth. The goal of statistics in clinical research is to control random error and reduce bias as much as possible.
An analogy: random error is like scatter when you aim at the center of a target; bias is when the aim itself is off-center. The bias that arises when Kaplan–Meier curves are misused under competing risks is not random error. Random error can be reduced by increasing sample size, but bias cannot be fixed without improving study design and data collection.
Bias is not something that statistical methods can always repair after data collection is complete. If the way participants are selected, responses are obtained, or outcomes are measured is systematically distorted, that distortion has already entered the analytic dataset.
Reducing bias therefore begins before the analysis plan. Questionnaire design, follow-up procedures, efforts to improve response rates, and standardized measurement rules can matter as much as the statistical model for the credibility of the study.
Major categories of bias
Me: “I get that biased data lead to bias. But sometimes you just can’t collect everything—like death information. You do your best. Are there other biases I should watch out for in my survey?”
Dad: “You’re mailing questionnaires, right? Low response rates can easily introduce bias, so you should think about ways to encourage responses. For example—are you asking about income?”
Me: “I might.”
Dad: “Sensitive questions need special care. If people avoid responding because of them, your analytic sample may no longer represent the target population.”
Me: “Anything else?”
Dad: “It’s also possible that patients with a stoma are more likely to respond than those without one. If response rates differ between groups, comparisons can be criticized as biased.”
Me: “Is that confounding?”
Dad: “Where did you hear that word? Good question—but this is a bit different. Differences in response rates affect which patients are sampled from the population. That’s called selection bias. And if the information itself is distorted—like people overstating their income—that’s information bias. In teaching study design, we often group bias into three categories:
Selection bias
Information bias
Confounding
Dad: “Thinking in these three categories at the design stage helps you plan countermeasures early: avoid selective inclusion, collect information carefully, and make groups comparable except for the factor of interest.”
Me: “Selection bias, information bias… Clinical research really does have its own language.”
Up to this point, we have been talking about the essence of research — how we frame research questions and plan to obtain unbiased answers. The following episodes step away from study design and begin to reflect on observed effects and their uncertainty, how we reason about causes, and what ultimately becomes publishable.
Past episodes
- A Story of Coffee Chat and Research Hypothesis
- Data Have Types: A Coffee-Chat Guide to R Functions for Common Outcomes
- Outcomes: The Bridge from Data Collection to Analysis
- A First Step into Survival and Competing Risks Analysis with R
- When Bias Creeps In: Selection, Information, and Confounding in Clinical Surveys
- Statistical Terms in Plain Language
- study-design.R